FX-Arabia

جديد المواضيع


الملاحظات

منتدى تداول العملات العالمية العام (الفوركس) Forex منتدى العملات العام Forex فى هذا القسم يتم مناقشه كل ما يتعلق بـسوق تداول العملات العالمية الفوركس و مناقشة طرق التحليل المختلفة و تحليل المعادن , الذهب ، الفضة ، البترول من خلال تحليل فني ، تحليل اساسي ،اخبار اقتصادية متجددة ، تحليل رقمى ، مسابقات متعددة ، توصيات ، تحليلات ، التداول ، استراتيجيات مختلفة ، توصيات فوركس ، بورصة العملات ، الفوركس ، تجارة الفوركس ، يورو دولار ، باوند دولار ، بونص فوركس ، تداول ، اسهم ، عملات ، افضل موقع فوركس


ورشة الاشموكو

منتدى تداول العملات العالمية العام (الفوركس) Forex


إضافة رد
 
أدوات الموضوع
قديم 26-08-2013, 01:13 AM   المشاركة رقم: 511
الكاتب
خالوود
عضو فضى
الصورة الرمزية خالوود

البيانات
تاريخ التسجيل: Sep 2010
رقم العضوية: 1272
المشاركات: 2,561
بمعدل : 0.49 يوميا

الإتصالات
الحالة:
خالوود غير متواجد حالياً
وسائل الإتصال:

كاتب الموضوع : خالوود المنتدى : منتدى تداول العملات العالمية العام (الفوركس) Forex
افتراضي رد: ورشة الاشموكو

التنكن ديلي بعيد شوية، خليه ينزل عنده واشتريه.
ولو اني احبد الابتعاد عن اليورو دولار لانه غير واضح.
احذر 1.35 ففيها سيلتقي الكيجن الشهري بالشنكو الشهري.


عرض البوم صور خالوود  
رد مع اقتباس
  #511  
قديم 26-08-2013, 01:13 AM
خالوود خالوود غير متواجد حالياً
عضو فضى
افتراضي رد: ورشة الاشموكو

التنكن ديلي بعيد شوية، خليه ينزل عنده واشتريه.
ولو اني احبد الابتعاد عن اليورو دولار لانه غير واضح.
احذر 1.35 ففيها سيلتقي الكيجن الشهري بالشنكو الشهري.


رد مع اقتباس
قديم 26-08-2013, 12:18 PM   المشاركة رقم: 512
الكاتب
عبدالحكيم
عضو جديد

البيانات
تاريخ التسجيل: Mar 2011
رقم العضوية: 3208
العمر: 55
المشاركات: 80
بمعدل : 0.02 يوميا

الإتصالات
الحالة:
عبدالحكيم غير متواجد حالياً
وسائل الإتصال:

كاتب الموضوع : خالوود المنتدى : منتدى تداول العملات العالمية العام (الفوركس) Forex
افتراضي رد: ورشة الاشموكو

لماذا توقف صعود الذهب ( مؤقتا ) للنقاش والفائدة فقط فأنا لا أتاجر بالذهب

واستاذنا خالد اتمنى ان يوضح لي حيث احتاج لذلك المستويات المسطحة ماذا تعني بالضبط هل هي جاذبة للسعر حتى لو كانت بعيدة ؟

هنا الذهب توقف عند الكيجن الاسبوعي والشنكو اليومي لم يستطع اختراق السحابة والسنكو سبان اي
لهذا يجب علينا اثناء المتاجرة متابعة المستويات القوية فربما تفسد علينا خططنا التي نرسمها على الفريمات الصغيرة .. بالتوفيق

نقره لعرض الصورة في صفحة مستقلة


عرض البوم صور عبدالحكيم  
رد مع اقتباس
  #512  
قديم 26-08-2013, 12:18 PM
عبدالحكيم عبدالحكيم غير متواجد حالياً
عضو جديد
افتراضي رد: ورشة الاشموكو

لماذا توقف صعود الذهب ( مؤقتا ) للنقاش والفائدة فقط فأنا لا أتاجر بالذهب

واستاذنا خالد اتمنى ان يوضح لي حيث احتاج لذلك المستويات المسطحة ماذا تعني بالضبط هل هي جاذبة للسعر حتى لو كانت بعيدة ؟

هنا الذهب توقف عند الكيجن الاسبوعي والشنكو اليومي لم يستطع اختراق السحابة والسنكو سبان اي
لهذا يجب علينا اثناء المتاجرة متابعة المستويات القوية فربما تفسد علينا خططنا التي نرسمها على الفريمات الصغيرة .. بالتوفيق

نقره لعرض الصورة في صفحة مستقلة


رد مع اقتباس
قديم 26-08-2013, 01:19 PM   المشاركة رقم: 513
الكاتب
خالوود
عضو فضى
الصورة الرمزية خالوود

البيانات
تاريخ التسجيل: Sep 2010
رقم العضوية: 1272
المشاركات: 2,561
بمعدل : 0.49 يوميا

الإتصالات
الحالة:
خالوود غير متواجد حالياً
وسائل الإتصال:

كاتب الموضوع : خالوود المنتدى : منتدى تداول العملات العالمية العام (الفوركس) Forex
افتراضي رد: ورشة الاشموكو

المشاركة الأصلية كتبت بواسطة عبدالحكيم نقره لعرض الصورة في صفحة مستقلة
لماذا توقف صعود الذهب ( مؤقتا ) للنقاش والفائدة فقط فأنا لا أتاجر بالذهب

واستاذنا خالد اتمنى ان يوضح لي حيث احتاج لذلك المستويات المسطحة ماذا تعني بالضبط هل هي جاذبة للسعر حتى لو كانت بعيدة ؟

هنا الذهب توقف عند الكيجن الاسبوعي والشنكو اليومي لم يستطع اختراق السحابة والسنكو سبان اي
لهذا يجب علينا اثناء المتاجرة متابعة المستويات القوية فربما تفسد علينا خططنا التي نرسمها على الفريمات الصغيرة .. بالتوفيق

نقره لعرض الصورة في صفحة مستقلة
اهلا عبد الحكيم، كلامك صحيحييييييييييييييييح نقره لعرض الصورة في صفحة مستقلة


عرض البوم صور خالوود  
رد مع اقتباس
  #513  
قديم 26-08-2013, 01:19 PM
خالوود خالوود غير متواجد حالياً
عضو فضى
افتراضي رد: ورشة الاشموكو

المشاركة الأصلية كتبت بواسطة عبدالحكيم نقره لعرض الصورة في صفحة مستقلة
لماذا توقف صعود الذهب ( مؤقتا ) للنقاش والفائدة فقط فأنا لا أتاجر بالذهب

واستاذنا خالد اتمنى ان يوضح لي حيث احتاج لذلك المستويات المسطحة ماذا تعني بالضبط هل هي جاذبة للسعر حتى لو كانت بعيدة ؟

هنا الذهب توقف عند الكيجن الاسبوعي والشنكو اليومي لم يستطع اختراق السحابة والسنكو سبان اي
لهذا يجب علينا اثناء المتاجرة متابعة المستويات القوية فربما تفسد علينا خططنا التي نرسمها على الفريمات الصغيرة .. بالتوفيق

نقره لعرض الصورة في صفحة مستقلة
اهلا عبد الحكيم، كلامك صحيحييييييييييييييييح نقره لعرض الصورة في صفحة مستقلة


رد مع اقتباس
قديم 26-08-2013, 10:15 PM   المشاركة رقم: 514
الكاتب
Badr
عضو متميز
الصورة الرمزية Badr

البيانات
تاريخ التسجيل: Mar 2012
رقم العضوية: 8855
الدولة: CAiRO
العمر: 34
المشاركات: 1,194
بمعدل : 0.26 يوميا

الإتصالات
الحالة:
Badr غير متواجد حالياً
وسائل الإتصال:

كاتب الموضوع : خالوود المنتدى : منتدى تداول العملات العالمية العام (الفوركس) Forex
افتراضي رد: ورشة الاشموكو

خالد كم نسبة النجاح للتجارة بهذا الأسبلوب ؟
يعنى تقدر تعمل تقرير للأخر 3 شهور بعدد الصفقات الناجحة و عدد الصفقات الخاسرة و ايضا عدد النقاط الى ربحتها و عدد النقاط الى خسرتها ؟


التوقيع

NO PAiN NO GAiN
DON`T COUNT YOUR CHICKEN BEFORE THEY HATCH

اللهم إن كان رزقي في السماء فأنزله وإن كان في الأرض فأخرجه
وإن كان بعيدا فقربه وإن كان قريبا فيسره وإن كان قليلا فأكثره وإن كان كثيرا فباركه


عرض البوم صور Badr  
رد مع اقتباس
  #514  
قديم 26-08-2013, 10:15 PM
Badr Badr غير متواجد حالياً
عضو متميز
افتراضي رد: ورشة الاشموكو

خالد كم نسبة النجاح للتجارة بهذا الأسبلوب ؟
يعنى تقدر تعمل تقرير للأخر 3 شهور بعدد الصفقات الناجحة و عدد الصفقات الخاسرة و ايضا عدد النقاط الى ربحتها و عدد النقاط الى خسرتها ؟


رد مع اقتباس
قديم 27-08-2013, 12:40 AM   المشاركة رقم: 515
الكاتب
خالوود
عضو فضى
الصورة الرمزية خالوود

البيانات
تاريخ التسجيل: Sep 2010
رقم العضوية: 1272
المشاركات: 2,561
بمعدل : 0.49 يوميا

الإتصالات
الحالة:
خالوود غير متواجد حالياً
وسائل الإتصال:

كاتب الموضوع : خالوود المنتدى : منتدى تداول العملات العالمية العام (الفوركس) Forex
افتراضي رد: ورشة الاشموكو

المشاركة الأصلية كتبت بواسطة Badr نقره لعرض الصورة في صفحة مستقلة
خالد كم نسبة النجاح للتجارة بهذا الأسبلوب ؟
يعنى تقدر تعمل تقرير للأخر 3 شهور بعدد الصفقات الناجحة و عدد الصفقات الخاسرة و ايضا عدد النقاط الى ربحتها و عدد النقاط الى خسرتها ؟
كان بودي يا اخي لكن هذا الكلام لا اومن به، فحسب تجربتي لا يمكنني ان التزم بععد نقاط محدد في الشهر، حيث يمكن ان ابقي على ربح او خسارة بين 10 و 30% من راس المال في انتظار الفرص الكبيرة التي ابقى عليها لمدة طويلة فيكون الربح خيالي.
اقول لك مثلا عند انعكاس ترند ازواج الين اشتريت اليورو ين والدولار ين والباوند ين والاسترالي ين والنتيجة كانت اني ربحت مرة ونصف راسمالي. وقبلها كنت قد بعت اليورو دولار والباوند دولار وربحت مرتين راسمالي.
هذه هي الفرص الكبرى للي حققت فيها ربح كبير اما في ما تبقى فالارباح كما الخائر تراوح بين 10% و 30% في الشهر.
هناك كذلك عامل مهم وهو نفسيتي، في الكثير من الاحيان لما يكون عندي مشاكل، ادخل السوق واخسر وهذا شيء مهم تعلمته ان لا ادخل السوق وانا مشعول باشياء اخرى.
الخلاصة ان 99% من خسائري تكون مني وليست من النظام، اما عدم انتباه، او دماغي مشعول...

بالنسبة للي يقدر يحقق نسبة معينة من راسماله كل شهر، اقول له برافو، اما انا فاظن ان هذا الامر غير ممكن.


عرض البوم صور خالوود  
رد مع اقتباس
  #515  
قديم 27-08-2013, 12:40 AM
خالوود خالوود غير متواجد حالياً
عضو فضى
افتراضي رد: ورشة الاشموكو

المشاركة الأصلية كتبت بواسطة Badr نقره لعرض الصورة في صفحة مستقلة
خالد كم نسبة النجاح للتجارة بهذا الأسبلوب ؟
يعنى تقدر تعمل تقرير للأخر 3 شهور بعدد الصفقات الناجحة و عدد الصفقات الخاسرة و ايضا عدد النقاط الى ربحتها و عدد النقاط الى خسرتها ؟
كان بودي يا اخي لكن هذا الكلام لا اومن به، فحسب تجربتي لا يمكنني ان التزم بععد نقاط محدد في الشهر، حيث يمكن ان ابقي على ربح او خسارة بين 10 و 30% من راس المال في انتظار الفرص الكبيرة التي ابقى عليها لمدة طويلة فيكون الربح خيالي.
اقول لك مثلا عند انعكاس ترند ازواج الين اشتريت اليورو ين والدولار ين والباوند ين والاسترالي ين والنتيجة كانت اني ربحت مرة ونصف راسمالي. وقبلها كنت قد بعت اليورو دولار والباوند دولار وربحت مرتين راسمالي.
هذه هي الفرص الكبرى للي حققت فيها ربح كبير اما في ما تبقى فالارباح كما الخائر تراوح بين 10% و 30% في الشهر.
هناك كذلك عامل مهم وهو نفسيتي، في الكثير من الاحيان لما يكون عندي مشاكل، ادخل السوق واخسر وهذا شيء مهم تعلمته ان لا ادخل السوق وانا مشعول باشياء اخرى.
الخلاصة ان 99% من خسائري تكون مني وليست من النظام، اما عدم انتباه، او دماغي مشعول...

بالنسبة للي يقدر يحقق نسبة معينة من راسماله كل شهر، اقول له برافو، اما انا فاظن ان هذا الامر غير ممكن.


رد مع اقتباس
قديم 27-08-2013, 12:47 AM   المشاركة رقم: 516
الكاتب
Designer
عضو جديد
الصورة الرمزية Designer

البيانات
تاريخ التسجيل: Sep 2012
رقم العضوية: 11043
المشاركات: 58
بمعدل : 0.01 يوميا

الإتصالات
الحالة:
Designer غير متواجد حالياً
وسائل الإتصال:

كاتب الموضوع : خالوود المنتدى : منتدى تداول العملات العالمية العام (الفوركس) Forex
افتراضي رد: ورشة الاشموكو

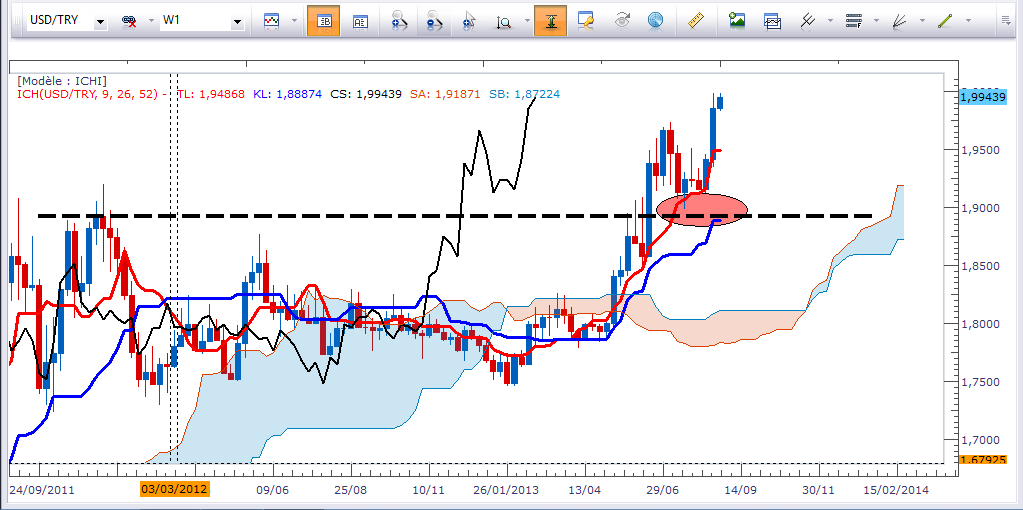
استاذ خالد مساء الخير ممكن حضرتك تعطي رايك بزوج usd try لانه عامل قمة جديده .. وشكراً لك


عرض البوم صور Designer  
رد مع اقتباس
  #516  
قديم 27-08-2013, 12:47 AM
Designer Designer غير متواجد حالياً
عضو جديد
افتراضي رد: ورشة الاشموكو

استاذ خالد مساء الخير ممكن حضرتك تعطي رايك بزوج usd try لانه عامل قمة جديده .. وشكراً لك


رد مع اقتباس
قديم 27-08-2013, 01:02 AM   المشاركة رقم: 517
الكاتب
خالوود
عضو فضى
الصورة الرمزية خالوود

البيانات
تاريخ التسجيل: Sep 2010
رقم العضوية: 1272
المشاركات: 2,561
بمعدل : 0.49 يوميا

الإتصالات
الحالة:
خالوود غير متواجد حالياً
وسائل الإتصال:

كاتب الموضوع : خالوود المنتدى : منتدى تداول العملات العالمية العام (الفوركس) Forex
افتراضي رد: ورشة الاشموكو

المشاركة الأصلية كتبت بواسطة Designer نقره لعرض الصورة في صفحة مستقلة
استاذ خالد مساء الخير ممكن حضرتك تعطي رايك بزوج usd try لانه عامل قمة جديده .. وشكراً لك

الفرصة فاتت لما رجع لاختبار راس الشنكو اما الان فيمكن ان يرجع لاختبار التنكن الاسبوعي.
وكما ترى لا زال لم يعمل قمة جديدة لانه لم يخترق قمة الاسبوع الماضي.


يمكن الشراء بنقطة واحدة فوق قمة الاسبوع الماضي بستوب صغير واخد 30 او 40 نقطة بسرعة. هذا اذا تمكن من فعل هذه النقطة فوق هاي الاسبوع الماضي 1.9989.

نقره لعرض الصورة في صفحة مستقلة


عرض البوم صور خالوود  
رد مع اقتباس
  #517  
قديم 27-08-2013, 01:02 AM
خالوود خالوود غير متواجد حالياً
عضو فضى
افتراضي رد: ورشة الاشموكو

المشاركة الأصلية كتبت بواسطة Designer نقره لعرض الصورة في صفحة مستقلة
استاذ خالد مساء الخير ممكن حضرتك تعطي رايك بزوج usd try لانه عامل قمة جديده .. وشكراً لك

الفرصة فاتت لما رجع لاختبار راس الشنكو اما الان فيمكن ان يرجع لاختبار التنكن الاسبوعي.
وكما ترى لا زال لم يعمل قمة جديدة لانه لم يخترق قمة الاسبوع الماضي.


يمكن الشراء بنقطة واحدة فوق قمة الاسبوع الماضي بستوب صغير واخد 30 او 40 نقطة بسرعة. هذا اذا تمكن من فعل هذه النقطة فوق هاي الاسبوع الماضي 1.9989.

نقره لعرض الصورة في صفحة مستقلة


رد مع اقتباس
قديم 27-08-2013, 01:35 PM   المشاركة رقم: 518
الكاتب
hector23
عضو نشيط

البيانات
تاريخ التسجيل: Jun 2012
رقم العضوية: 10124
المشاركات: 350
بمعدل : 0.08 يوميا

الإتصالات
الحالة:
hector23 غير متواجد حالياً
وسائل الإتصال:

كاتب الموضوع : خالوود المنتدى : منتدى تداول العملات العالمية العام (الفوركس) Forex
افتراضي رد: ورشة الاشموكو

السلام عليكم
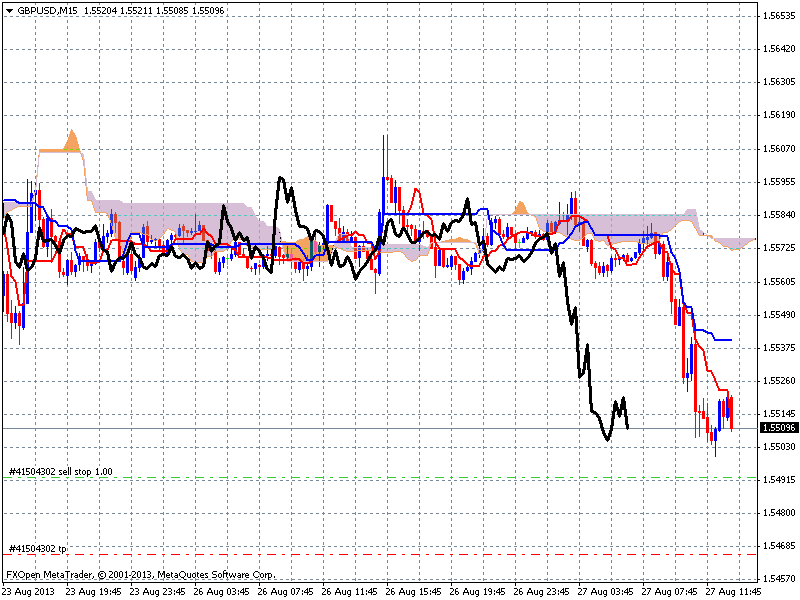
هذه فرصه مازالت تتكون على GBP/USD فريم 15 دقيقه حيث احتمال تكون راس شينكو و تم وضع اوامر معلقه

الدخول 1.54925
الهدف 1.54655
الستوب لوز ساضعه اذا تفعلت الصفقه فوق الكيجن ب 15 نقطه

نقره لعرض الصورة في صفحة مستقلة


التوقيع

[CENTER]
طاعة الله هى طريق النجاح

عرض البوم صور hector23  
رد مع اقتباس
  #518  
قديم 27-08-2013, 01:35 PM
hector23 hector23 غير متواجد حالياً
عضو نشيط
افتراضي رد: ورشة الاشموكو

السلام عليكم
هذه فرصه مازالت تتكون على GBP/USD فريم 15 دقيقه حيث احتمال تكون راس شينكو و تم وضع اوامر معلقه

الدخول 1.54925
الهدف 1.54655
الستوب لوز ساضعه اذا تفعلت الصفقه فوق الكيجن ب 15 نقطه

نقره لعرض الصورة في صفحة مستقلة


رد مع اقتباس
قديم 27-08-2013, 02:14 PM   المشاركة رقم: 519
الكاتب
خالوود
عضو فضى
الصورة الرمزية خالوود

البيانات
تاريخ التسجيل: Sep 2010
رقم العضوية: 1272
المشاركات: 2,561
بمعدل : 0.49 يوميا

الإتصالات
الحالة:
خالوود غير متواجد حالياً
وسائل الإتصال:

كاتب الموضوع : خالوود المنتدى : منتدى تداول العملات العالمية العام (الفوركس) Forex
افتراضي رد: ورشة الاشموكو

المشاركة الأصلية كتبت بواسطة hector23 نقره لعرض الصورة في صفحة مستقلة
السلام عليكم
هذه فرصه مازالت تتكون على GBP/USD فريم 15 دقيقه حيث احتمال تكون راس شينكو و تم وضع اوامر معلقه

الدخول 1.54925
الهدف 1.54655
الستوب لوز ساضعه اذا تفعلت الصفقه فوق الكيجن ب 15 نقطه

نقره لعرض الصورة في صفحة مستقلة
هذا هو راس الشنكو. الفرصة فاتت الان والشنكو يومي اختبر السحابة، الزوج الان فوق دعم، لا يصح البيع.


نقره لعرض الصورة في صفحة مستقلة


عرض البوم صور خالوود  
رد مع اقتباس
  #519  
قديم 27-08-2013, 02:14 PM
خالوود خالوود غير متواجد حالياً
عضو فضى
افتراضي رد: ورشة الاشموكو

المشاركة الأصلية كتبت بواسطة hector23 نقره لعرض الصورة في صفحة مستقلة
السلام عليكم
هذه فرصه مازالت تتكون على GBP/USD فريم 15 دقيقه حيث احتمال تكون راس شينكو و تم وضع اوامر معلقه

الدخول 1.54925
الهدف 1.54655
الستوب لوز ساضعه اذا تفعلت الصفقه فوق الكيجن ب 15 نقطه

نقره لعرض الصورة في صفحة مستقلة
هذا هو راس الشنكو. الفرصة فاتت الان والشنكو يومي اختبر السحابة، الزوج الان فوق دعم، لا يصح البيع.


نقره لعرض الصورة في صفحة مستقلة


رد مع اقتباس
قديم 27-08-2013, 02:24 PM   المشاركة رقم: 520
الكاتب
خالوود
عضو فضى
الصورة الرمزية خالوود

البيانات
تاريخ التسجيل: Sep 2010
رقم العضوية: 1272
المشاركات: 2,561
بمعدل : 0.49 يوميا

الإتصالات
الحالة:
خالوود غير متواجد حالياً
وسائل الإتصال:

كاتب الموضوع : خالوود المنتدى : منتدى تداول العملات العالمية العام (الفوركس) Forex
افتراضي رد: ورشة الاشموكو

sPECULATIVE SENTIMENT INDEX fxcm

USDJPY - The ratio of long to short positions in the USDJPY stands at 2.10 as 68% of traders are long. Yesterday the ratio was 2.17; 68% of open positions were long. Long positions are 9.5% higher than yesterday and 7.0% below levels seen last week. Short positions are 13.0% higher than yesterday and 16.8% above levels seen last week. Open interest is 10.6% higher than yesterday and 1.6% above its monthly average. We use our SSI as a contrarian indicator to price action, and the fact that the majority of traders are long gives signal that the USDJPY may continue lower. The trading crowd has grown less net-long from yesterday and last week. The combination of current sentiment and recent changes gives a further mixed trading bias.
EURUSD - The ratio of long to short positions in the EURUSD stands at -2.63 as 28% of traders are long. Yesterday the ratio was -2.90; 26% of open positions were long. Long positions are 8.7% higher than yesterday and 2.5% above levels seen last week. Short positions are 1.5% lower than yesterday and 1.1% below levels seen last week. Open interest is 1.1% higher than yesterday and 0.8% above its monthly average. We use our SSI as a contrarian indicator to price action, and the fact that the majority of traders are short gives signal that the EURUSD may continue higher. The trading crowd has grown less net-short from yesterday and last week. The combination of current sentiment and recent changes gives a further mixed trading bias.
GBPUSD - The ratio of long to short positions in the GBPUSD stands at -1.93 as 34% of traders are long. Yesterday the ratio was -1.99; 33% of open positions were long. Long positions are 5.6% higher than yesterday and 5.9% above levels seen last week. Short positions are 2.4% higher than yesterday and 22.5% below levels seen last week. Open interest is 3.5% higher than yesterday and 2.8% above its monthly average. We use our SSI as a contrarian indicator to price action, and the fact that the majority of traders are short gives signal that the GBPUSD may continue higher. The trading crowd has grown less net-short from yesterday and last week. The combination of current sentiment and recent changes gives a further mixed trading bias.
GBPJPY - The ratio of long to short positions in the GBPJPY stands at -2.06 as 33% of traders are long. Yesterday the ratio was -2.22; 31% of open positions were long. Long positions are 21.2% higher than yesterday and 27.0% above levels seen last week. Short positions are 12.8% higher than yesterday and 1.6% below levels seen last week. Open interest is 15.4% higher than yesterday and 24.9% above its monthly average. We use our SSI as a contrarian indicator to price action, and the fact that the majority of traders are short gives signal that the GBPJPY may continue higher. The trading crowd has grown less net-short from yesterday and last week. The combination of current sentiment and recent changes gives a further mixed trading bias.
USDCHF - The ratio of long to short positions in the USDCHF stands at 4.41 as 82% of traders are long. Yesterday the ratio was 4.61; 82% of open positions were long. Long positions are 2.5% higher than yesterday and 9.9% above levels seen last week. Short positions are 7.3% higher than yesterday and 4.5% above levels seen last week. Open interest is 3.4% higher than yesterday and 12.7% above its monthly average. We use our SSI as a contrarian indicator to price action, and the fact that the majority of traders are long gives signal that the USDCHF may continue lower. The trading crowd has grown less net-long from yesterday but further long since last week. The combination of current sentiment and recent changes gives a further mixed trading bias.
USDCAD - The ratio of long to short positions in the USDCAD stands at -2.01 as 33% of traders are long. Yesterday the ratio was -2.05; 33% of open positions were long. Long positions are 1.5% higher than yesterday and 32.4% below levels seen last week. Short positions are 0.9% lower than yesterday and 71.3% above levels seen last week. Open interest is 0.2% lower than yesterday and 9.9% above its monthly average. We use our SSI as a contrarian indicator to price action, and the fact that the majority of traders are short gives signal that the USDCAD may continue higher. The trading crowd has grown less net-short from yesterday but unchanged since last week. The combination of current sentiment and recent changes gives a further mixed trading bias.
AUDUSD - The ratio of long to short positions in the AUDUSD stands at 2.83 as 74% of traders are long. Yesterday the ratio was 2.57; 72% of open positions were long. Long positions are 8.7% higher than yesterday and 14.6% above levels seen last week. Short positions are 1.5% lower than yesterday and 9.6% below levels seen last week. Open interest is 5.8% higher than yesterday and 3.1% above its monthly average. We use our SSI as a contrarian indicator to price action, and the fact that the majority of traders are long gives signal that the AUDUSD may continue lower. The trading crowd has grown further net-long from yesterday and last week. The combination of current sentiment and recent changes gives a further bearish trading bias.
NZDUSD - The ratio of long to short positions in the NZDUSD stands at 2.01 as 67% of traders are long. Yesterday the ratio was 2.27; 69% of open positions were long. Long positions are 3.2% higher than yesterday and 59.5% above levels seen last week. Short positions are 16.7% higher than yesterday and 22.8% below levels seen last week. Open interest is 7.3% higher than yesterday and 32.7% above its monthly average. We use our SSI as a contrarian indicator to price action, and the fact that the majority of traders are long gives signal that the NZDUSD may continue lower. The trading crowd has grown less net-long from yesterday but unchanged since last week. The combination of current sentiment and recent changes gives a further mixed trading bias.
EURCHF - The ratio of long to short positions in the EURCHF stands at 6.03 as 86% of traders are long. Yesterday the ratio was 7.22; 88% of open positions were long. Long positions are 3.7% lower than yesterday and 5.8% above levels seen last week. Short positions are 15.4% higher than yesterday and 12.4% above levels seen last week. Open interest is 1.3% lower than yesterday and 0.3% below its monthly average. We use our SSI as a contrarian indicator to price action, and the fact that the majority of traders are long gives signal that the EURCHF may continue lower. The trading crowd has grown less net-long from yesterday and last week. The combination of current sentiment and recent changes gives a further mixed trading bias.
XAUUSD - The ratio of long to short positions in the XAUUSD stands at -1.02 as 50% of traders are long. Yesterday the ratio was -1.34; 43% of open positions were long. Long positions are 14.0% higher than yesterday and 4.7% below levels seen last week. Short positions are 13.3% lower than yesterday and 15.7% above levels seen last week. Open interest is 1.6% lower than yesterday and 7.9% above its monthly average. We use our SSI as a contrarian indicator to price action, and the fact that the majority of traders are short gives signal that the XAUUSD may continue higher. The trading crowd has grown less net-short from yesterday but unchanged since last week. The combination of current sentiment and recent changes gives a further mixed trading bias.
SPX500 - The ratio of long to short positions in the SPX500 stands at -2.80 as 26% of traders are long. Yesterday the ratio was -2.17; 32% of open positions were long. Long positions are 17.6% lower than yesterday and 26.5% below levels seen last week. Short positions are 6.3% higher than yesterday and 13.9% above levels seen last week. Open interest is 1.2% lower than yesterday and 5.0% below its monthly average. We use our SSI as a contrarian indicator to price action, and the fact that the majority of traders are short gives signal that the SPX500 may continue higher. The trading crowd has grown further net-short from yesterday and last week. The combination of current sentiment and recent changes gives a further bullish trading bias.
EURJPY - The ratio of long to short positions in the EURJPY stands at -3.05 as 25% of traders are long. Yesterday the ratio was -3.43; 23% of open positions were long. Long positions are 13.8% higher than yesterday and 10.7% below levels seen last week. Short positions are 1.0% higher than yesterday and 23.2% above levels seen last week. Open interest is 3.9% higher than yesterday and 18.8% above its monthly average. We use our SSI as a contrarian indicator to price action, and the fact that the majority of traders are short gives signal that the EURJPY may continue higher. The trading crowd has grown less net-short from yesterday but further short since last week. The combination of current sentiment and recent changes gives a further mixed trading bias.
How do we interpret the SSI? Watch an FXCM Expo Presentation that explains the SSI.


عرض البوم صور خالوود  
رد مع اقتباس
  #520  
قديم 27-08-2013, 02:24 PM
خالوود خالوود غير متواجد حالياً
عضو فضى
افتراضي رد: ورشة الاشموكو

sPECULATIVE SENTIMENT INDEX fxcm

USDJPY - The ratio of long to short positions in the USDJPY stands at 2.10 as 68% of traders are long. Yesterday the ratio was 2.17; 68% of open positions were long. Long positions are 9.5% higher than yesterday and 7.0% below levels seen last week. Short positions are 13.0% higher than yesterday and 16.8% above levels seen last week. Open interest is 10.6% higher than yesterday and 1.6% above its monthly average. We use our SSI as a contrarian indicator to price action, and the fact that the majority of traders are long gives signal that the USDJPY may continue lower. The trading crowd has grown less net-long from yesterday and last week. The combination of current sentiment and recent changes gives a further mixed trading bias.
EURUSD - The ratio of long to short positions in the EURUSD stands at -2.63 as 28% of traders are long. Yesterday the ratio was -2.90; 26% of open positions were long. Long positions are 8.7% higher than yesterday and 2.5% above levels seen last week. Short positions are 1.5% lower than yesterday and 1.1% below levels seen last week. Open interest is 1.1% higher than yesterday and 0.8% above its monthly average. We use our SSI as a contrarian indicator to price action, and the fact that the majority of traders are short gives signal that the EURUSD may continue higher. The trading crowd has grown less net-short from yesterday and last week. The combination of current sentiment and recent changes gives a further mixed trading bias.
GBPUSD - The ratio of long to short positions in the GBPUSD stands at -1.93 as 34% of traders are long. Yesterday the ratio was -1.99; 33% of open positions were long. Long positions are 5.6% higher than yesterday and 5.9% above levels seen last week. Short positions are 2.4% higher than yesterday and 22.5% below levels seen last week. Open interest is 3.5% higher than yesterday and 2.8% above its monthly average. We use our SSI as a contrarian indicator to price action, and the fact that the majority of traders are short gives signal that the GBPUSD may continue higher. The trading crowd has grown less net-short from yesterday and last week. The combination of current sentiment and recent changes gives a further mixed trading bias.
GBPJPY - The ratio of long to short positions in the GBPJPY stands at -2.06 as 33% of traders are long. Yesterday the ratio was -2.22; 31% of open positions were long. Long positions are 21.2% higher than yesterday and 27.0% above levels seen last week. Short positions are 12.8% higher than yesterday and 1.6% below levels seen last week. Open interest is 15.4% higher than yesterday and 24.9% above its monthly average. We use our SSI as a contrarian indicator to price action, and the fact that the majority of traders are short gives signal that the GBPJPY may continue higher. The trading crowd has grown less net-short from yesterday and last week. The combination of current sentiment and recent changes gives a further mixed trading bias.
USDCHF - The ratio of long to short positions in the USDCHF stands at 4.41 as 82% of traders are long. Yesterday the ratio was 4.61; 82% of open positions were long. Long positions are 2.5% higher than yesterday and 9.9% above levels seen last week. Short positions are 7.3% higher than yesterday and 4.5% above levels seen last week. Open interest is 3.4% higher than yesterday and 12.7% above its monthly average. We use our SSI as a contrarian indicator to price action, and the fact that the majority of traders are long gives signal that the USDCHF may continue lower. The trading crowd has grown less net-long from yesterday but further long since last week. The combination of current sentiment and recent changes gives a further mixed trading bias.
USDCAD - The ratio of long to short positions in the USDCAD stands at -2.01 as 33% of traders are long. Yesterday the ratio was -2.05; 33% of open positions were long. Long positions are 1.5% higher than yesterday and 32.4% below levels seen last week. Short positions are 0.9% lower than yesterday and 71.3% above levels seen last week. Open interest is 0.2% lower than yesterday and 9.9% above its monthly average. We use our SSI as a contrarian indicator to price action, and the fact that the majority of traders are short gives signal that the USDCAD may continue higher. The trading crowd has grown less net-short from yesterday but unchanged since last week. The combination of current sentiment and recent changes gives a further mixed trading bias.
AUDUSD - The ratio of long to short positions in the AUDUSD stands at 2.83 as 74% of traders are long. Yesterday the ratio was 2.57; 72% of open positions were long. Long positions are 8.7% higher than yesterday and 14.6% above levels seen last week. Short positions are 1.5% lower than yesterday and 9.6% below levels seen last week. Open interest is 5.8% higher than yesterday and 3.1% above its monthly average. We use our SSI as a contrarian indicator to price action, and the fact that the majority of traders are long gives signal that the AUDUSD may continue lower. The trading crowd has grown further net-long from yesterday and last week. The combination of current sentiment and recent changes gives a further bearish trading bias.
NZDUSD - The ratio of long to short positions in the NZDUSD stands at 2.01 as 67% of traders are long. Yesterday the ratio was 2.27; 69% of open positions were long. Long positions are 3.2% higher than yesterday and 59.5% above levels seen last week. Short positions are 16.7% higher than yesterday and 22.8% below levels seen last week. Open interest is 7.3% higher than yesterday and 32.7% above its monthly average. We use our SSI as a contrarian indicator to price action, and the fact that the majority of traders are long gives signal that the NZDUSD may continue lower. The trading crowd has grown less net-long from yesterday but unchanged since last week. The combination of current sentiment and recent changes gives a further mixed trading bias.
EURCHF - The ratio of long to short positions in the EURCHF stands at 6.03 as 86% of traders are long. Yesterday the ratio was 7.22; 88% of open positions were long. Long positions are 3.7% lower than yesterday and 5.8% above levels seen last week. Short positions are 15.4% higher than yesterday and 12.4% above levels seen last week. Open interest is 1.3% lower than yesterday and 0.3% below its monthly average. We use our SSI as a contrarian indicator to price action, and the fact that the majority of traders are long gives signal that the EURCHF may continue lower. The trading crowd has grown less net-long from yesterday and last week. The combination of current sentiment and recent changes gives a further mixed trading bias.
XAUUSD - The ratio of long to short positions in the XAUUSD stands at -1.02 as 50% of traders are long. Yesterday the ratio was -1.34; 43% of open positions were long. Long positions are 14.0% higher than yesterday and 4.7% below levels seen last week. Short positions are 13.3% lower than yesterday and 15.7% above levels seen last week. Open interest is 1.6% lower than yesterday and 7.9% above its monthly average. We use our SSI as a contrarian indicator to price action, and the fact that the majority of traders are short gives signal that the XAUUSD may continue higher. The trading crowd has grown less net-short from yesterday but unchanged since last week. The combination of current sentiment and recent changes gives a further mixed trading bias.
SPX500 - The ratio of long to short positions in the SPX500 stands at -2.80 as 26% of traders are long. Yesterday the ratio was -2.17; 32% of open positions were long. Long positions are 17.6% lower than yesterday and 26.5% below levels seen last week. Short positions are 6.3% higher than yesterday and 13.9% above levels seen last week. Open interest is 1.2% lower than yesterday and 5.0% below its monthly average. We use our SSI as a contrarian indicator to price action, and the fact that the majority of traders are short gives signal that the SPX500 may continue higher. The trading crowd has grown further net-short from yesterday and last week. The combination of current sentiment and recent changes gives a further bullish trading bias.
EURJPY - The ratio of long to short positions in the EURJPY stands at -3.05 as 25% of traders are long. Yesterday the ratio was -3.43; 23% of open positions were long. Long positions are 13.8% higher than yesterday and 10.7% below levels seen last week. Short positions are 1.0% higher than yesterday and 23.2% above levels seen last week. Open interest is 3.9% higher than yesterday and 18.8% above its monthly average. We use our SSI as a contrarian indicator to price action, and the fact that the majority of traders are short gives signal that the EURJPY may continue higher. The trading crowd has grown less net-short from yesterday but further short since last week. The combination of current sentiment and recent changes gives a further mixed trading bias.
How do we interpret the SSI? Watch an FXCM Expo Presentation that explains the SSI.


رد مع اقتباس
إضافة رد

مواقع النشر (المفضلة)

الكلمات الدلالية (Tags)
ورشة, الاشموكو


تعليمات المشاركة
لا تستطيع إضافة مواضيع جديدة
لا تستطيع الرد على المواضيع
لا تستطيع إرفاق ملفات
لا تستطيع تعديل مشاركاتك

BB code is متاحة
كود [IMG] متاحة
كود HTML معطلة


الساعة الآن 11:27 PM


جميع الحقوق محفوظة الى اف اكس ارابيا www.fx-arabia.com

تحذير المخاطرة

التجارة بالعملات الأجنبية تتضمن علي قدر كبير من المخاطر ومن الممكن ألا تكون مناسبة لجميع المضاربين, إستعمال الرافعة المالية في التجاره يزيد من إحتمالات الخطورة و التعرض للخساره, عليك التأكد من قدرتك العلمية و الشخصية على التداول.

تنبيه هام

موقع اف اكس ارابيا هو موقع تعليمي خالص يهدف الي توعية المستثمر العربي مبادئ الاستثمار و التداول الناجح ولا يتحصل علي اي اموال مقابل ذلك ولا يقوم بادارة محافظ مالية وان ادارة الموقع غير مسؤولة عن اي استغلال من قبل اي شخص لاسمها وتحذر من ذلك.

اتصل بنا

البريد الإلكتروني للدعم الفنى : support@fx-arabia.com
جميع الحقوق محفوظة اف اكس ارابيا – احدى مواقع Inwestopedia Sp. Z O.O. للاستشارات و التدريب – جمهورية بولندا الإتحادية.
Powered by vBulletin® Copyright ©2000 - 2024 , Designed by Fx-Arabia Team