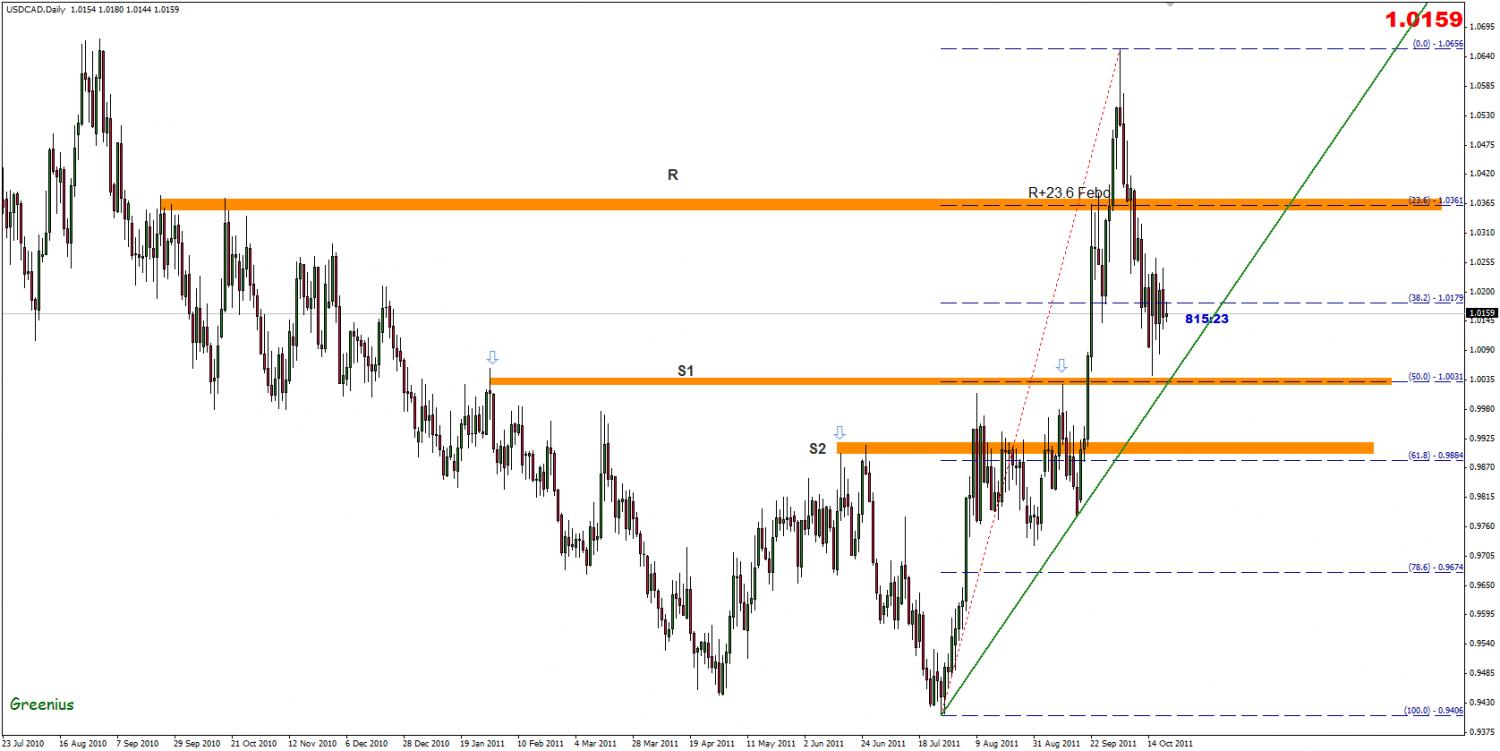
At daily chart we have R at 23.6 Febo level 1.0361 and S with 50 febo and another one at 61.8 febo ok
let go to 4h chart we find that we have sideways trend let find 161.8 for wave 1 & 2
we conclude that if price breakout underside of rectangle target will be 23.6 daily febo with 161.8 febo
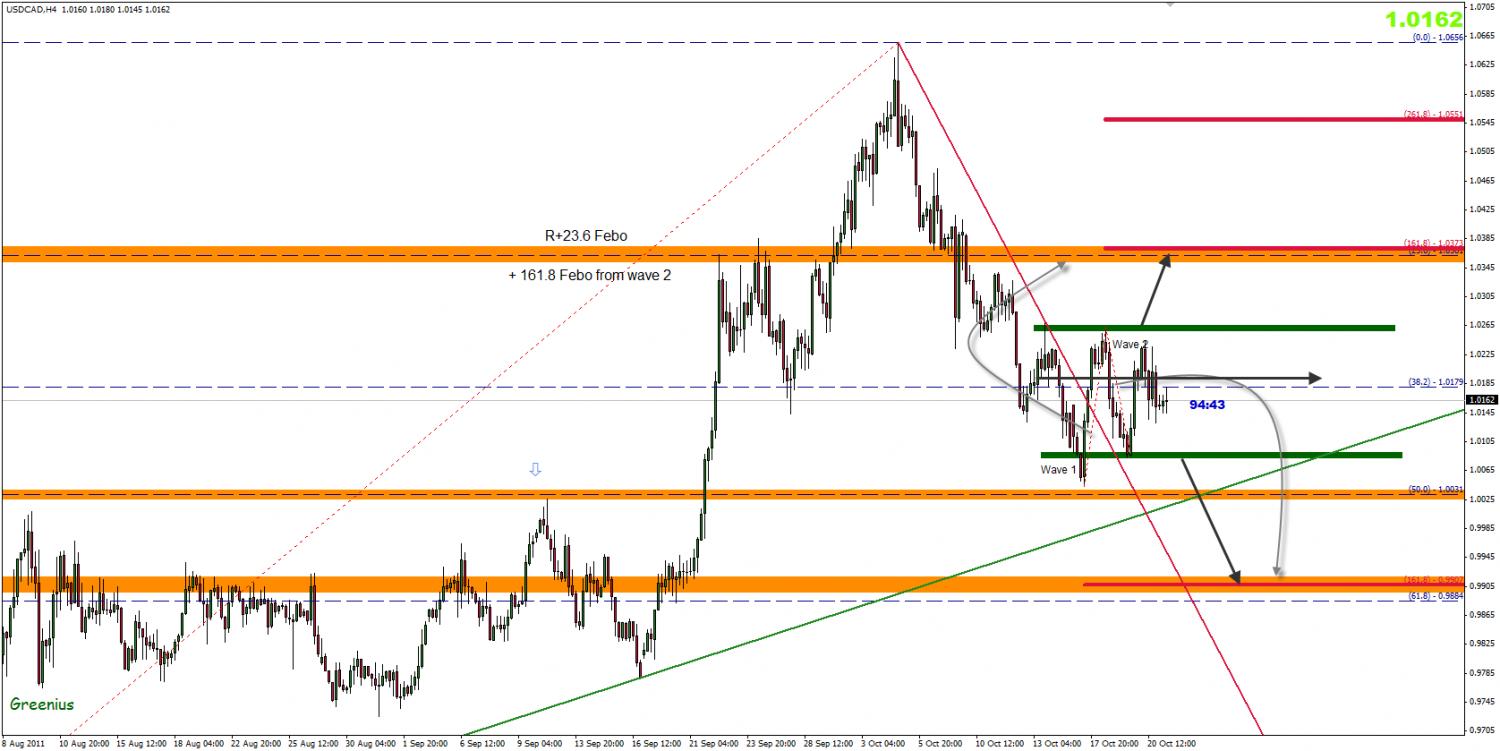
and if downside target will be 61.8 +161.8 of wave 2